ADF application with UI Shell and ADF Task Flows rendered in dynamic tabs would not offer instant switch from one tab to another experience. Thats because tab switch request goes to the server and only when browser gets response - tab switch happens. There is more to this - even if tab in ADF is not currently active (tab is disclosed), tab content (e.g. region rendered from ADF Task Flow) still may participate in the request processing. If user opens many tabs, this could result in slightly slower request processing time overall.
ADF allows to render ADF Task Flows directly by accessing them through URL, if it is configured with page support on the root level. ADF Task Flow can be accessed by URL, this means we can include it into iframe. Imagine using iframe for each tab and rendering ADF Task Flows inside. This will enable ADF Task Flow independent processing in each tab, similar to opening them in separate browser tab.
Iframe can be managed in Oracle JET, using plain JavaScript and HTML code. My sample implements dynamic JET tabs with iframe support. Iframe renders ADF Task Flow. While navigating between tabs, I simply hide/show iframes, this allows to keep the state of ADF Task Flow and return to the same state, when opening back the tab. Huge advantage in this case - tab navigation and switching between tabs with ADF Task Flows works very fast - it takes only client time processing. Look at this recorded gif, where I navigate between tabs with ADF content:

Main functions are listed below.
1. Add dynamic iframe. Here we check if frame for given ADF Task Flow is already created, if no we create it and append to HTML element

2. Select iframe, when switching tabs. Hide all frames first, select frame which belongs to the selected tab

3. Remove iframe. Remove frame, when tab is closed

4. Select frame after remove. This method helps to set focus to the next frame, after current tab was removed

We can control when iframe or regular JET module is rendered, by using flag computed function assigned to main div:

In this app I have defined static URL's for displayed ADF Task Flows. Same can be loaded by fetching menu, etc.:

To be able to load ADF Task Flow by URL, make sure to use ADF Task Flow with page (you can include ADF region with fragments into that page). Set url-invoke-allowed property:

This is how it looks like. By default, JET dashboard module is displayed, select item from the menu list to load tab with ADF Task Flow:

JET tab rendering iframe with ADF table:

You can monitor ADF content loading in iframe within JET application:

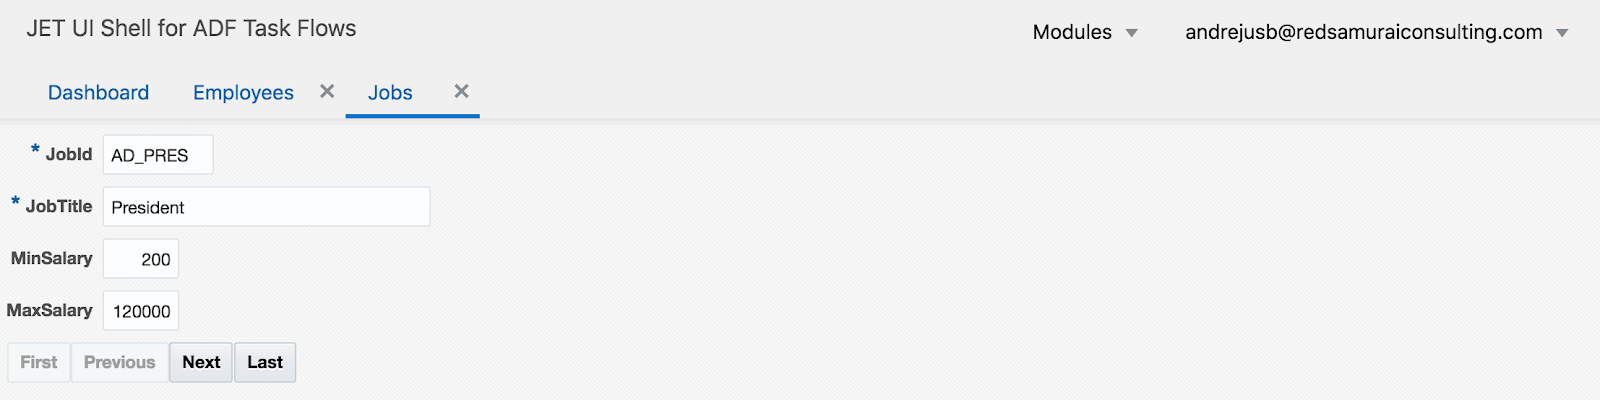
JET tab rendering iframe with ADF form:

Download sample app from GitHub repository.
ADF allows to render ADF Task Flows directly by accessing them through URL, if it is configured with page support on the root level. ADF Task Flow can be accessed by URL, this means we can include it into iframe. Imagine using iframe for each tab and rendering ADF Task Flows inside. This will enable ADF Task Flow independent processing in each tab, similar to opening them in separate browser tab.
Iframe can be managed in Oracle JET, using plain JavaScript and HTML code. My sample implements dynamic JET tabs with iframe support. Iframe renders ADF Task Flow. While navigating between tabs, I simply hide/show iframes, this allows to keep the state of ADF Task Flow and return to the same state, when opening back the tab. Huge advantage in this case - tab navigation and switching between tabs with ADF Task Flows works very fast - it takes only client time processing. Look at this recorded gif, where I navigate between tabs with ADF content:

Main functions are listed below.
1. Add dynamic iframe. Here we check if frame for given ADF Task Flow is already created, if no we create it and append to HTML element

2. Select iframe, when switching tabs. Hide all frames first, select frame which belongs to the selected tab

3. Remove iframe. Remove frame, when tab is closed

4. Select frame after remove. This method helps to set focus to the next frame, after current tab was removed

We can control when iframe or regular JET module is rendered, by using flag computed function assigned to main div:

In this app I have defined static URL's for displayed ADF Task Flows. Same can be loaded by fetching menu, etc.:

To be able to load ADF Task Flow by URL, make sure to use ADF Task Flow with page (you can include ADF region with fragments into that page). Set url-invoke-allowed property:

This is how it looks like. By default, JET dashboard module is displayed, select item from the menu list to load tab with ADF Task Flow:

JET tab rendering iframe with ADF table:

You can monitor ADF content loading in iframe within JET application:

JET tab rendering iframe with ADF form:
Download sample app from GitHub repository.
16 comments:
@"There is more to this - even if tab in ADF is not currently active (tab is disclosed), tab content (e.g. region rendered from ADF Task Flow) still may participate in the request processing."
- I noticed exactly the same!
Why is so, and have you idea on how to avoid this strange behavior?
This is how ADF server side works, it needs to process all open resources during request, even some of the resources are not really used. This was one of the main reasons, why I created JET UI Shell wrapper - to avoid this behaviour.
Regards,
Andrejus
This is a really bad.
One question: do you have some experience with complex ADF UI Shell applications in production? For example, with max 6 opened tabs, each having Isolated taskFlow inside. I know it depends of application, but many simultaneous users such one application can support?
Also I am interested in AM pooling params.
We have just one app module.
In order to support 100 sim. users, what should be value of Referenced pool size?
Well, this is how framework works behind the scenes. Whatever resource user keeps active at the moment, as AM's - these resources are revisited during request. This means AMs from open tabs (the ones which are open, but not disclosed too) - will be 'touched' and DB connection will be established and released instantly. Based on our tests, if user opens 10 tabs with ADF TF's, delay for request processing could be around 1 second. But if same app is deployed on powerful server, delay for this functionality drops to 0.25 second. So, it really depends on server side processing power.
Regarding your question: yes we have both Oracle UI Shell and custom ADF UI Shell apps in production. Typically we allow to open up to 10 tabs with ADF Isolated TFs. If application is well tuned, and server hardware is strong - typically it can run 500 concurrent users per each managed server node. This means if you need to support 2000 concurrent users, would need to have 4 nodes.
100 concurrent users is not much for ADF, this number should be handled easily if app is properly tuned. I would recommend to set Referenced Pool Size to be larger than estimated number of users, to avoid passivation/activation. Key tuning point - try to avoid passivations/activations, since passivation/activation is main slowdown for ADF runtime performance. Check my previous post: http://andrejusb.blogspot.com/2013/12/how-to-minimize-number-of-adf-bc.html
Thanks for valuable response
Last questions:
For our app, we are tune those settings:
Initial pool size : 160
Minimum available size: 160
Maximum available size: 200
Referenced pool size: 200
Idle instance timeout (= session timeout from web.xml): 7200
jbo.ampool.timetolive: -1
jbo.doconnectionpooling: true
jbo.txn.disconnect_level = 1
Enable application module pooling: yes
Yet, when running app in integrated WebLogic, (module that just display data from one DB table in read-only mode) we noticed that framework calls ApplicationModuleImpl.passivateState(), very often.
Is not that pretty unusual?
@" If application is well tuned, and server hardware is strong - typically it can run 500 concurrent users per each managed server node."
-Can you specify more precise what "strong hardware" in your case means?
I would set Minimum Pool Size to 0 and increase Idle Instance Timeout to be more than web session timeout.
But, if you still have passivation/activation, means app code is written badly and only tuning would not help. Normally if Referenced Pool Size is set to be more than number of sessions, there should be no passivation/activation.
In your case if you see passivations/activations even on integrated server, no hardware will help :)
Andrejus
And I just call Thread.dumpStack() in the overriden passivateState(), in order to see what actually causes AM passivation.
Interesting, looks like at end of each request, the SessionCookieImpl calls releaseApplicaiotnModule(), which then causes passivateState()
Can you comment something on this?
at oracle.jbo.server.ApplicationPoolMessageHandler.doPoolMessage(ApplicationPoolMessageHandler.java:396)
at oracle.jbo.server.ApplicationModuleImpl.doPoolMessage(ApplicationModuleImpl.java:9958)
at oracle.jbo.common.ampool.ApplicationPoolImpl.sendPoolMessage(ApplicationPoolImpl.java:4614)
at oracle.jbo.common.ampool.ApplicationPoolImpl.doManagedCheckin(ApplicationPoolImpl.java:2787)
at oracle.jbo.common.ampool.ApplicationPoolImpl.releaseApplicationModule(ApplicationPoolImpl.java:1547)
at oracle.jbo.common.ampool.SessionCookieImpl.releaseApplicationModule(SessionCookieImpl.java:858)
at oracle.jbo.common.ampool.SessionCookieImpl.releaseApplicationModule(SessionCookieImpl.java:778)
at oracle.adf.model.bc4j.DCJboDataControl.releaseApplicationModule(DCJboDataControl.java:2645)
at oracle.adf.model.bc4j.DCJboDataControl.endRequest(DCJboDataControl.java:2292)
at oracle.adf.model.dcframe.DataControlFrameImpl.endRequestInternal(DataControlFrameImpl.java:859)
at oracle.adf.model.dcframe.DataControlFrameImpl.endRequest(DataControlFrameImpl.java:727)
at oracle.adf.model.BindingContext.endRequest(BindingContext.java:2583)
at oracle.adf.model.BindingRequestHandler.invokeEndRequest(BindingRequestHandler.java:476)
at oracle.adf.model.BindingRequestHandler.endRequest(BindingRequestHandler.java:345)
This approach improves performance and user experience, but i have a couple of questions as i have no time to test them.
How to handle dirty states, as you can not handle that from JET (in order to warn the user).
Perhaps you have to deal with iframes unloading, in order to use a beforeunload event of ADF side (or perhaps your code can already fires that event).
I don't know if beforeunload event of ADF side will be executed, and the event of the JET iframe component can not detect any ADF dirty state.
If TFs are URL invoked and you can close the tabs from JET, then the TFs are not finalized when using application, so this approach increases the number of "zombie pageFlow scopes" that will die when session expires.
Enough memory would avoid any problem, but i wonder if this cloud be handled some way.
Thanks.
Anonymous, something is messed up in your code. If you get passivation/activation while running on integrated server with single session, something is really really bad in the app.
This would required code debugging, to answer what is wrong exactly. But I'm sure - tuning alone would not help, until code is not fixed.
I'm willing to help you, if you want please get in touch by email and we could have a call on Skype to debug it.
Andrejus
Juan, thanks for your questions.
Answers:
1. If you want to handle dirty state, when closing JET tab - you could call JS method located in ADF frame from JS wrapper. This method could check for dirty changes and prevent tab from closing, if there are any dirty changes
2. TF's are not finalized when closed, even when they are loaded in ADF UI Shell. If you want to finalize, also could follow JS call approach on tab close from JET wrapper. This JS call would invoke ADF server listener, and you do finalize logic there
Andrejus
Hi Andrejus,
Thanks for the help offer, but everything is fine with our app.
Simply, there is multiple passivateState() methods in the ApplicationModuleImpl.
The first one
public int passivateState(int id, byte[] clientData, int flags)
which framework call at the end of _every request, and second one,
protected void passivateState(Document aDocument, Element aElement)
which framework calls only if AM passivation really happens.
So, when I override the second one, I notice that real passivation never happens in standalone WebLogic
Thanks for all again.
P.S. can you tell me now, what is "strong hardware" means in order to serve 500 concurent users? ;-)
Ok, so there is no passivation/activation really.
Example for strong hardware from one of the projects - Dell PowerEdge R730, 2 CPU sockets, Intel Xeon E5-2667 v3 at 3.2 GHz, 8 cores per socket, 392 GB memory
Let me know if further help will be required. We could share our ADF runtime performance audit tool, which logs system runtime metrics specific to ADF and this helps to tune problematic system areas.
Andrejus
And that machine serves both database/WebLogic, or WebLogic only?
I am trying to compare with our hardware resources...
Is there any website related to your audit tool?
This machine is dedicated for WebLogic only.
Audit tool info - http://andrejusb.blogspot.com/search/label/Extensions, customer feedback - http://www.redsamuraiconsulting.com/audit.html
Keep in mind - we dont sell this tool, but give away for free (including source code). But we don't allow public download. To get it, you should send email to me, describe in more detail your ADF implementation and we give URL to download.
Andrejus
I am sent you mail.
Just to verify - 392 GB RAM for one WL instance?
What is JVM memory arguments?
Thats for WLS cluster of course. Normally we set up to 6 GB heap size per managed server.
I dont have list of JVM params, not administering the environment.
Andrejus
Post a Comment