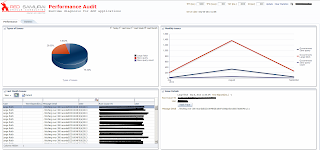
We are running our Red Samurai Performance Audit tool and monitoring ADF performance in various projects already for about one year and the half. It helps us a lot to understand ADF performance bottlenecks and tune slow ADF BC View Objects or optimise large ADF BC fetches from DB.
There is special update implemented for OOW'13 - advanced ADF BC statistics are collected directly from your application ADF BC runtime and later displayed as graphical information in the dashboard. I will be attending OOW'13 in San Francisco, feel free to stop me and ask about this tool - I will be happy to give it away and explain how to use it in your project.
Original audit screen with ADF BC performance issues, this is part of our Audit console application:
Audit console v1.1 is improved with one more tab - Statistics. This tab displays all SQL Selects statements produced by ADF BC over time, logged users, AM access load distribution and number of AM activations along with user sessions.
Available graphs:
1. Daily Queries - total number of SQL selects per day
2. Hourly Queries - Last 48 Hours
3. Logged Users - total number of user sessions per day
4. SQL Selects per Application Module - workload per Application Module
5. Number of Activations and User sessions - last 48 hours - displays stress load
6. Daily Transactions - insert, update and delete statements per day
7. Hourly Transactions - Last 48 Hours
See you at OOW'13 !


6 comments:
Dear Andrejus,
We are having tough times to minimize heap consumption of our ADF application (4 GB is allocated to it now). Application gets very slow and then web server crashes.
Please send us the tool and its reference manual and oblige.
Email: aaditya258@gmail.com
Regards,
Anuj
Hi Anuj,
Thanks for your request. We prefer to install and run performance audit by ourself in the projects. Or at least we need to guide project developers how to analyse performance. Main reason - is not that easy to understand what is really causing performance issue and how to fix it, only by looking at statistics.
If you will attend OOW, I will be happy to discuss it and give you source code. Currently we don't distribute source code for public download on the Web.
Andrejus
I wish you could publish the tool or we could buy it. This will help us not to re-invent the wheel.
You can hire Red Samurai for your project, we can install it for you and explain how to use it and tune performance.
Andrejus
Hi andrejus,I want to implement in my project i was much interested about this tool.help me how to implement
Hi,
We distribute this tool only for our customers or prospective customers.
Regards,
Andrejus
Post a Comment