Showing posts with label Performance. Show all posts

Friday, February 15, 2019

ADF Performance Improvement with Nginx Compression

We are using Nginx web server for Oracle ADF WorkBetter hosted demo hosted on DigitalOcean cloud server. Nginx helps to serve web application content fast and offer improved performance. One of the important tuning options - content compression, Nginx does this job well and is simple to setup.

Content compression doesn't provide direct runtime performance, a browser would run the same code, doesn't matter it was compressed or not. But it brings improved perceived performance (which is very important), network time is way faster, because of reduced content size. Oracle ADF is a server-side framework, each request would bring content from the server - faster this content comes, means better application performance.

1. Content Compression = OFF

Let see stats, when no content compression applied (using our Oracle ADF WorkBetter hosted demo).

Page load size is 2.69 MB transferred. Finish time 1.55 s:


Navigation to the employee section generates 165.76 KB and finish time 924 ms:


Navigation to employee compensation generates 46.19 KB and finish time 494 ms:


2. Nginx compression

Compression is simple to setup in Nginx. Gzip settings are set in nginx.conf, make sure to list all content types which must be supported for compression. Restart nginx process after new settings are saved in nginx.conf:


3. Content Compression = ON

Page load size is 733.84 KB transferred. Finish time 1.48 s:


Navigation to the employee section generates 72.75 KB and finish time 917 ms:


Navigation to employee compensation generates 7.59 KB and finish time 498 ms:

Tuesday, February 5, 2019

JDeveloper 12c IDE Performance Boost

There is a way to optimize JDeveloper 12c IDE performance by disabling some of the features you are not using.

I was positively surprised with improved JDeveloper responsiveness after turning off some of the features. ADF BC, Task Flow, and ADF Faces wizards started to respond in a noticeably faster way. Simple change and big performance gain, awesome.

One of the strongest JDeveloper performance improvements come from disabling TopLink feature. Ironically - TopLink is an abandoned product (12.1.3 was the last release). I remember back in 2006 TopLink was very promising and it was almost becoming the default platform for ADF Model. One of the old blog posts written by me related to TopLink - External Transaction Service in Oracle TopLink. But luckily it was overshadowed by ADF BC.

These are the features I disabled in my JDeveloper to get performance gain:

Friday, October 19, 2018

ADF Task Flow Performance Boost with JET UI Shell Wrapper

ADF application with UI Shell and ADF Task Flows rendered in dynamic tabs would not offer instant switch from one tab to another experience. Thats because tab switch request goes to the server and only when browser gets response - tab switch happens. There is more to this - even if tab in ADF is not currently active (tab is disclosed), tab content (e.g. region rendered from ADF Task Flow) still may participate in the request processing. If user opens many tabs, this could result in slightly slower request processing time overall.

ADF allows to render ADF Task Flows directly by accessing them through URL, if it is configured with page support on the root level. ADF Task Flow can be accessed by URL, this means we can include it into iframe. Imagine using iframe for each tab and rendering ADF Task Flows inside. This will enable ADF Task Flow independent processing in each tab, similar to opening them in separate browser tab.

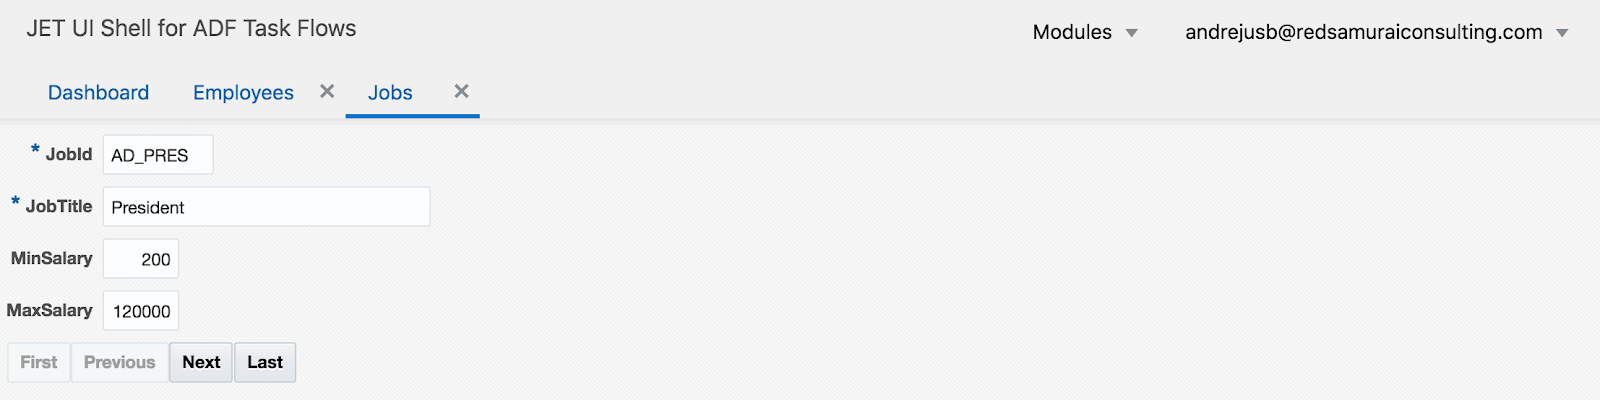
Iframe can be managed in Oracle JET, using plain JavaScript and HTML code. My sample implements dynamic JET tabs with iframe support. Iframe renders ADF Task Flow. While navigating between tabs, I simply hide/show iframes, this allows to keep the state of ADF Task Flow and return to the same state, when opening back the tab. Huge advantage in this case - tab navigation and switching between tabs with ADF Task Flows works very fast - it takes only client time processing. Look at this recorded gif, where I navigate between tabs with ADF content:


Main functions are listed below.

1. Add dynamic iframe. Here we check if frame for given ADF Task Flow is already created, if no we create it and append to HTML element


2. Select iframe, when switching tabs. Hide all frames first, select frame which belongs to the selected tab


3. Remove iframe. Remove frame, when tab is closed


4. Select frame after remove. This method helps to set focus to the next frame, after current tab was removed


We can control when iframe or regular JET module is rendered, by using flag computed function assigned to main div:


In this app I have defined static URL's for displayed ADF Task Flows. Same can be loaded by fetching menu, etc.:


To be able to load ADF Task Flow by URL, make sure to use ADF Task Flow with page (you can include ADF region with fragments into that page). Set url-invoke-allowed property:


This is how it looks like. By default, JET dashboard module is displayed, select item from the menu list to load tab with ADF Task Flow:


JET tab rendering iframe with ADF table:


You can monitor ADF content loading in iframe within JET application:


JET tab rendering iframe with ADF form:


Download sample app from GitHub repository.

Sunday, July 15, 2018

ADF Postback Payload Size Optimization

Recently I came across property called oracle.adf.view.rich.POSTBACK_PAYLOAD_TYPE. This property helps to optimize postback payload size. It is described in ADF Faces configuration section - A.2.3.16 Postback Payload Size Optimization. ADF partial request is executing HTTP post with values from all fields included. When postback property is set to dirty, it will include into HTTP post only changed values. As result - server will get only changed attributes, potentially this can reduce server time processing and make HTTP request size smaller. This especially can be important for large forms, with many fields.

Let's take a look into example. After clicking on any button in the form, go to network monitor and study Form Data section. You will see ID's and values for all fields included in the UI. All fields are submitted with HTTP request by default, even these fields were not changed:


Postback optimization property can be set in web.xml. By default it's value is full, change it to dirty:


With value set to dirty, try to change at least one field and then press any button. Observe Form Data section in network monitor - only fields with changed values will be submitted:


Try to test it in your project and see the difference.

Check my sample app for this use case on GitHub.

Sunday, May 27, 2018

Oracle ADF BC REST - Performance Review and Tuning

I thought to check how well ADF BC REST scales and how fast it performs. For that reason, I implemented sample ADF BC REST application and executed JMeter stress load test against it. You can access source code for application and JMeter script on my GitHub repository. Application is called Blog Visitor Counter app for a reason - I'm using same app to count blog visitors. This means each time you are accessing blog page - ADF BC REST service is triggered in the background and it logs counter value with timestamp (no personal data).

Application structure is straightforward - ADF BC REST implementation:


When REST service is accessed (GET request is executed) - it creates and commits new row in the background (this is why I like ADF BC REST - you have a lot of power and flexibility in the backend), before returning total logged rows count:


New row is assigned with counter value from DB sequence, as well as with timestamp. Both values are calculated in Groovy. Another bonus point for ADF BC REST, besides writing logic in Java - you can do scripting in Groovy - this makes code simpler:


Thats it - ADF BC REST service is ready to run. You may wonder, how I'm accessing it from blog page. ADF BC REST services as any other REST, can be invoked through HTTP request. In this particular case, I'm calling GET operation through Ajax call in JavaScript on client side. This script is uploaded to blogger HTML:


Performance

I'm using JMeter to execute performance test. In below example, REST GET request is invoked in infinite loop by 100 concurrent threads. This creates constant load and allows to measure how ADF BC REST application performs under such load:


ADF BC REST scales well, with 100 concurrent threads it does request processing in 0.1 - 0.2 seconds. If we would compare it to ADF UI request processing time, it would be around 10 times faster. This is expected, because JSF and ADF Faces UI classes are not used during ADF BC REST request. Performance test statistics for 100 threads, see Avg logged time in milliseconds:


Tuning

1. Referenced Pool Size and Application Module Pooling

ADF BC REST executes request is stateless mode, REST nature is stateless. I though to check, what this mean for Application Module tuning parameters. I have observed that changing Referenced Pool Size value doesn't influence application performance, it works either with 0 or any other value in the same way. Referenced Pool Size parameter is not important for ADF BC REST runtime:


Application performs well under load, there are no passivations/activations logged, even when Referenced Pool Size is set to zero.


However, I found that it is still important to keep Enable Application Module Pooling = ON. If you switch it OFF - passivation will start to appear, which consumes processing power and is highly unrecommended. So, keep Enable Application Module Pooling = ON.

2. Disconnect Application Module Upon Release

It is important to set Disconnect Application Module Upon Release = ON (read more about it - ADF BC Tuning with Do Connection Pooling and TXN Disconnect Level). This will ensure there will be always near zero DB connections left open:


Otherwise if we keep Disconnect Application Module Upon Release = OFF:


DB connections will not be released promptly:


This summarises important points related to ADF BC REST tuning.

Friday, November 17, 2017

ADF Performance on Docker - Lighting Fast

ADF performance depends on server processing power. Sometimes ADF is blamed for poor performance, but in most of the cases real issue is related to poor server hardware, bad programming style or slow response from DB. Goal of this post is to show how fast ADF request could execute and give away couple of suggestions how to minimize ADF request time. This would apply to ADF application running on any environment, not only Docker. I'm using ADF Alta UI based list application with edit fragment.

Rule number one - enable response compression. This will allow to transfer less data and obviously response will execute faster - shorter content download time. See in the screenshot below - JS file is compressed to 87 KB from original 411 KB. Initial page load in ADF generates around 3 MB of content (if this is very first access and static content is not cached yet on client side). With compression initial load of 3 MB will be around 300 - 400 KB. Thats a big difference. In this example ADF page opens in 1.2 seconds (this is equal to client side JS applications, if static content is downloaded on first access):


You can enable content response compression in WebLogic console (will be applied for all deployed Web apps). Go to domain configuration, Web Applications section:


Select checkbox to enable GZIP compression and provide a list of content types to be compressed:


Thats it - content compression is set.

When I navigate to edit fragment - request is executed in 305 ms. Thanks to fast Docker engine (running on Digital Ocean - Oracle ADF on Docker Container) and content response compression: 3.44 KB transferred for 14.49 KB original content:


Let's try Save operation. I changed Hire Date attribute and then pressed Save button. This will trigger Commit operation in ADF, push data to ADF BC and then execute DML statement with commit in DB. All these steps are completed in 113 ms.


Don't believe anyone who says ADF is slow. As you can see, ADF request is very fast fundamentally - but of course it can become slow, if you add a lot of data fetch and processing logic on top (blame yourself). Client side JS application would not run faster, if it would call backend REST service to save data. The only advantage of JS client side application in this case would be that it executes backend REST call asynchronously, while ADF calls requests in synchronous manner. However, it all depends - sometimes asynchronous calls are not suitable for business logic either.

How come ADF BC call to DB completes so fast? For that we need to check Data Source Connection Delay Time on WLS. In Docker (Digital Ocean) environment it is ridiculously short (thats very good): 66 ms. Check same on your server (go to Data Source monitoring in WLS console), longer delay time means slower response from DB and slower ADF performance:


Navigation back to the list runs in 356 ms, with 197.96 KB of content compressed to 10.47 KB. This is very fast, 350 ms response time is something that user would not notice (almost equal to processing on client side):


To optimize ADF performance, make sure you are using ChangeEventPolicy = NONE for iterators in Page Definitions:

Friday, November 10, 2017

ADF Performance Story - This Time Developer Was Wrong

ADF is fast. If ADF application is slow, most likely this is related to development mistakes. I would like to tell you one story, based on my ADF tuning experience. Problem description: ADF application runs fast in DEV, when DB size is small. Same application runs slow in TEST/PROD, when DB size is large. Question - what is slow. Answer - slow means forms are loading slow. Ok, lets go to the story.

Developer decides to fetch data from DB and iterate over rows to process them. This is already bad practice, because it is much more effective to process large sets of rows in DB directly, without fetching to middle tier. But let's assume this is valid use case and we really need to fetch rows. Developer implements fetching using getAllRowsInRange method:


VO data is loaded on UI and displayed in the table. Method to iterate through rows is called from button, this logic is not executed on initial load. Iterator is set with Range Size = 10:


This means first 10 rows are fetched on form load and it will open fast no matter of DB size:


This is OK, but while testing row fetching functionality - developer finds a "bug". He will see that instead of fetching all rows in custom method, only 10 rows are returned. And then developer decides to implement a fix - change Range Size to -1:


Now all rows are fetched in custom method, developer is happy. But there is small side effect - for some reason table starts to display all rows. Not good, another fix is needed:


Auto Height Rows = 10 is set to prevent table displaying too many rows. But really still all rows will be fetched, because Range Size = -1:


All these fixes are wrong. Method getAllRowsInRange is not supposed to be used to iterate through all rows, it will return only currently fetched rows. Such implementation obviously will slow down form load functionality, it will fetch all rows from DB, if DB size is large - it will slow down significantly.

If all what you need is to iterate through rows, make sure you dont affect data which is displayed/fetched for UI. Keep Range Size positive:


In custom method iterate through rows by creating rowset iterator:


Download sample application - ADFRangeSizeApp.zip.